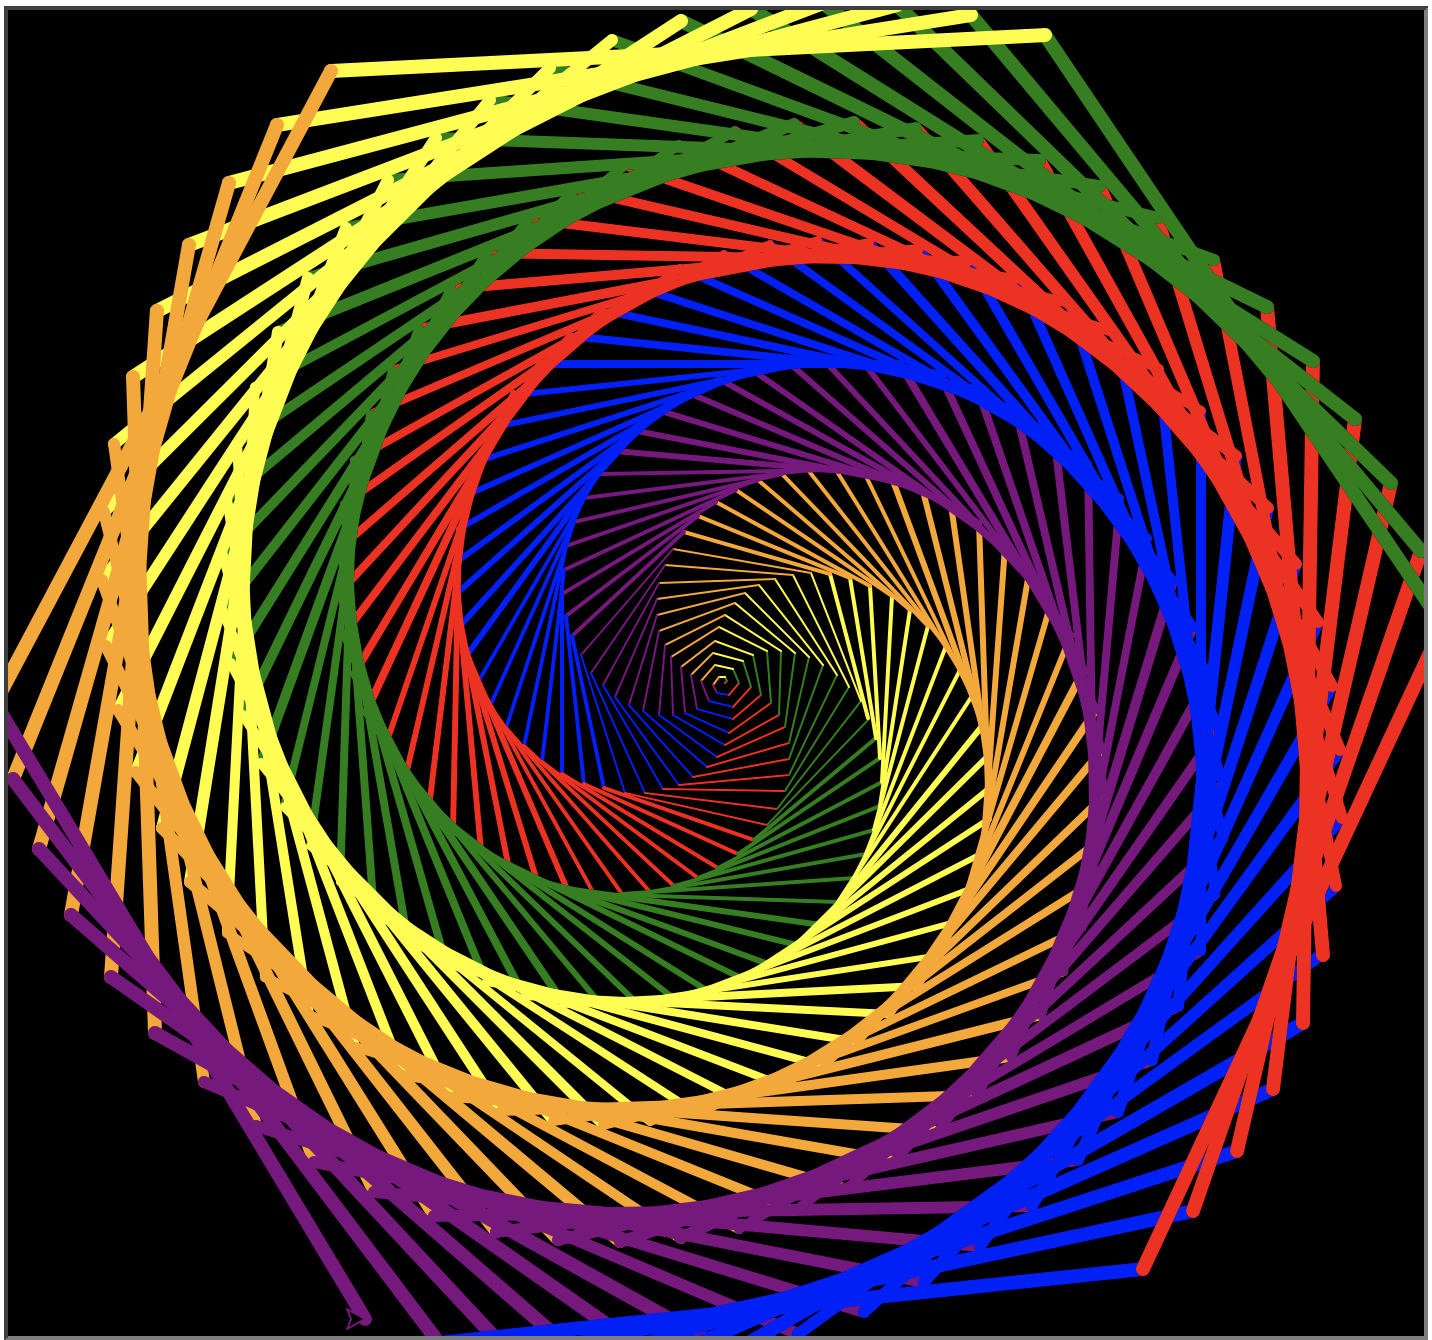
This is an old birthday gift for a special person. It was the first time I tried to plot something using python, and I wasn’t very familiar with matplotlib, so I used the turtle library. import turtleimport timedef auguri(): colors = [‘blue’, ‘red’, ‘green’, ‘yellow’, ‘orange’, ‘purple’] turtle.pensize(5) turtle.bgcolor(‘black’) turtle.speed(1000) for x in range(360): turtle.pencolor(colors[x […]
Tag: CoolPlot
Plotting 3D Lines
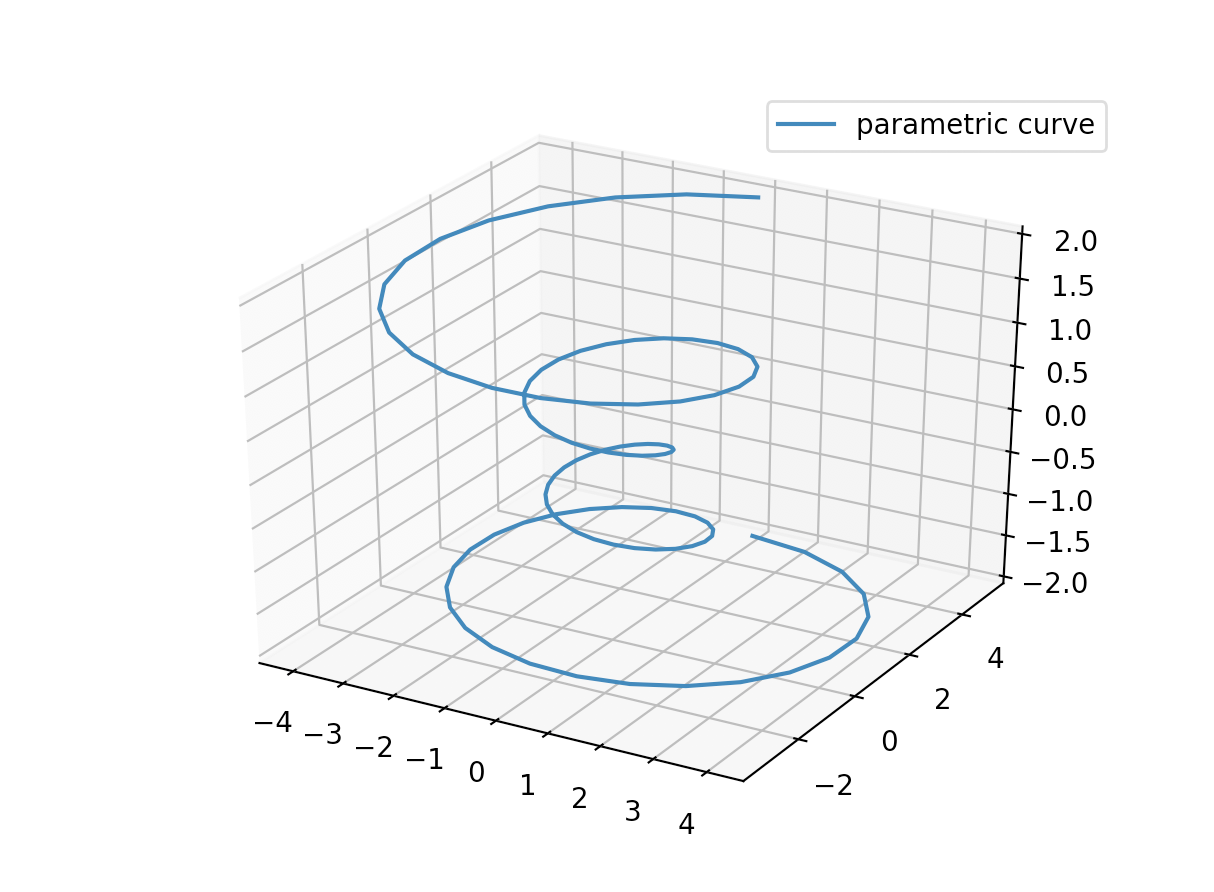
In Python as you know there’s the option of plotting 3D graphs, so why not fully exploiting such possibilities? In this example I will show a sort of an irregular spiral figure. import matplotlib as mplimport numpy as npimport matplotlib.pyplot as pltmpl.rcParams[‘legend.fontsize’] = 10fig = plt.figure()ax = fig.gca(projection=’3d’)theta = np.linspace(-4 * np.pi, 4 * np.pi, […]
Very Elegant Image Color Segmentation
Let’s start with this suggestive image of a tree with pink flowers on it. What I want to do is simplifying it to see its main colors. How can I do it? Well, here some unsupervised learning techniques may come in handy. Clustering the pixels of the image, which are no other than points in […]
Plotting Epicycloids
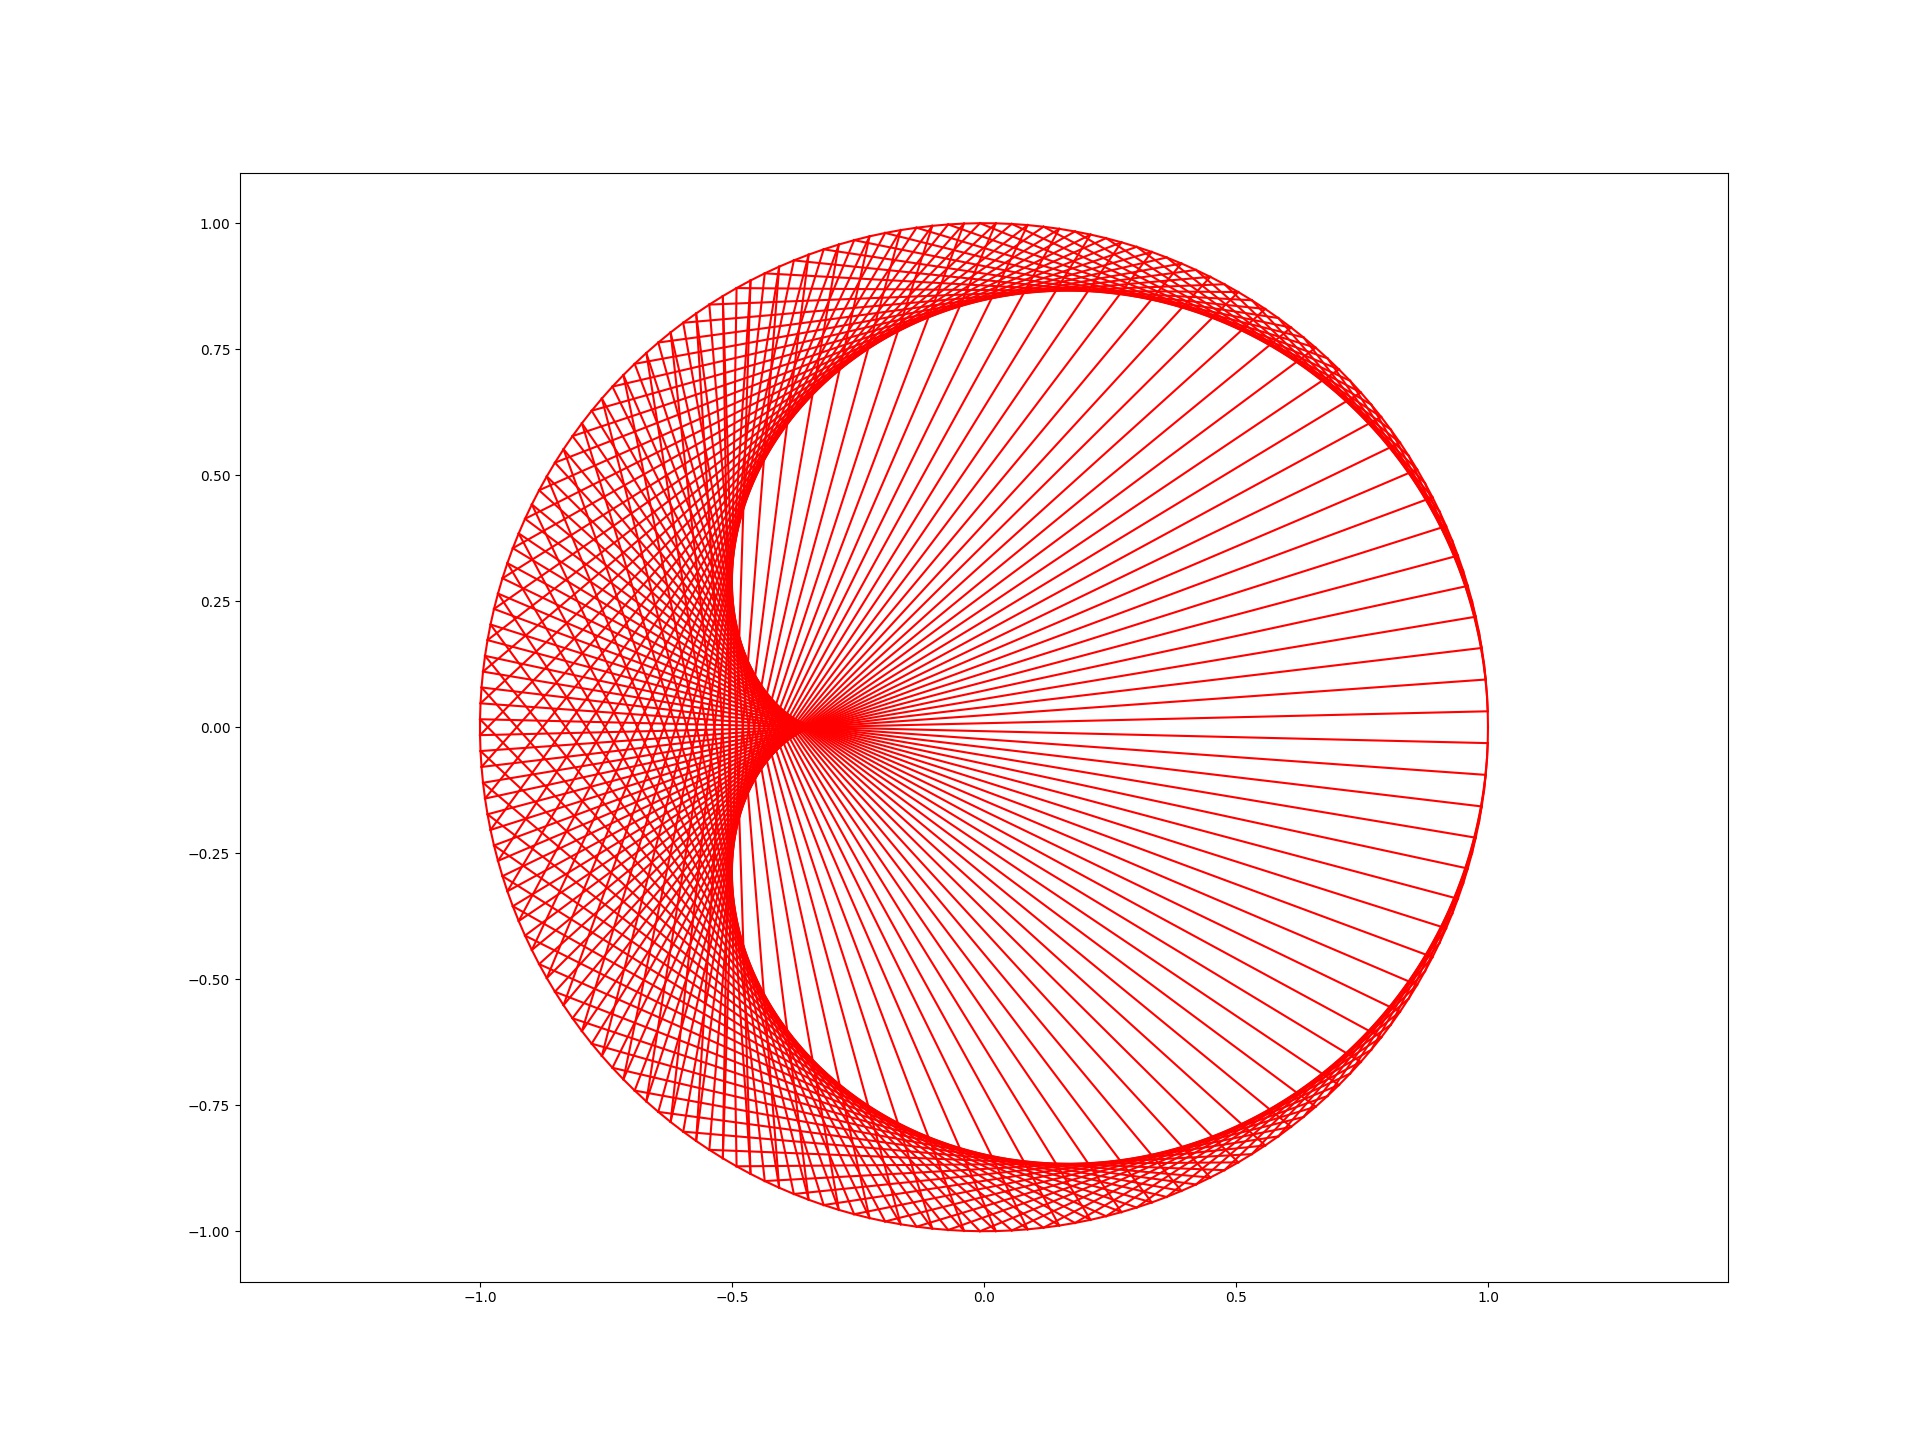
An epicycloid is the figure that a fixed point of a circle draws when the circle rotates on the circumference of another one. How to plot such things in Python? There is a trick: such figures depend on the ratio of the still circle’s and the rotating circle’s radius. Let’s say we have an integer […]
Happy Birthday Mom
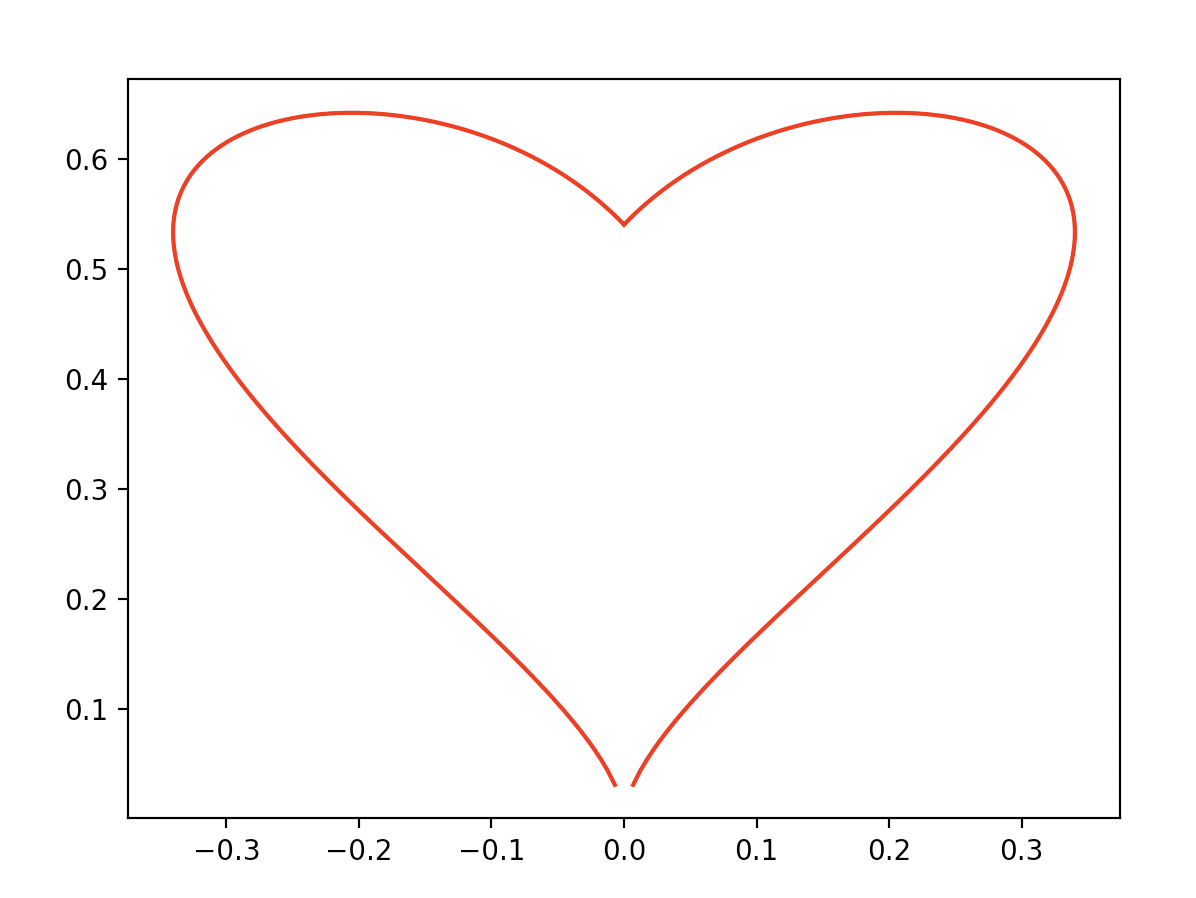
I Made this nice plot for my mother’s birthday (which is today, 4th December) and I thought it would be nice to share it. import numpy as npimport matplotlib.pyplot as pltdef heart_plotter(precision): t = np.linspace(0, 60, precision) X = 1/100*(-t**2 + 40*t + 1200)*np.sin(t/90) Y = 1/100*(-t**2 + 40*t + 1200)*np.cos(t/60) Y_1 = 1/100*(-t**2 + […]
Lorenz Attractor In Python Graphed
In my school course ‘Python For Physics’ we had to choose among some topics to study and implement in Python, and I and my colleague decided to go for the Lorenz Attractor equations. The Lorenz System is a system of differential equations which generates a very chaotic plot, where chaotic means that little variations may […]
Hearts Equations In Math
In this article, I’ll show you five different equations you can use to plot your own heart. Let’s start with the simplest: I think this is the most classic of the five I’m going to show you. If you prefer one which is a little bit thinner, there is this one: On the other hand, […]
Plotting Waves In Python
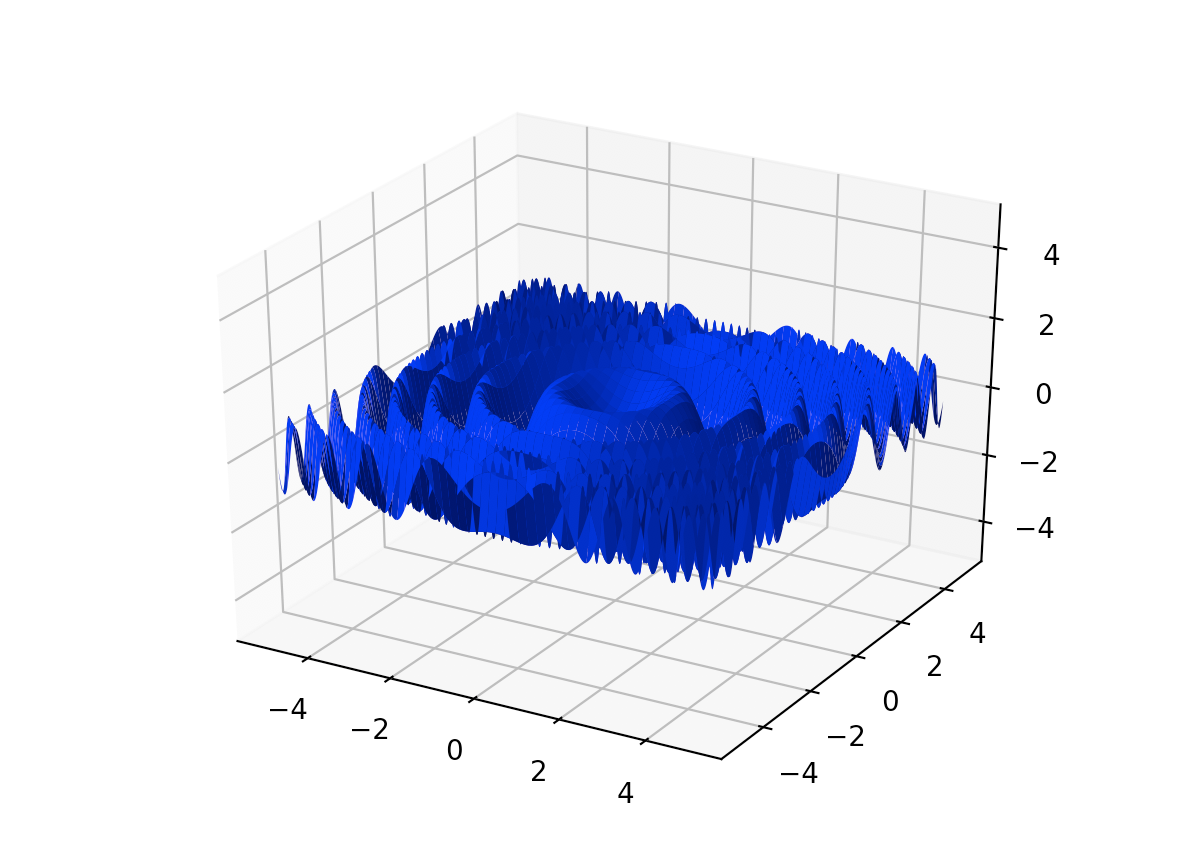
I really like plotting waves in Python: there are many ways you can show interesting patterns both in 2D and 3D. I’m obviously using the numpy and matplotlib libraries to create and plot the functions. 2D Wave Plot I really wanted to try to reproduce Arctic Monkeys’ AM cover image, and that’s what I was […]
Plotting A Torus With Python
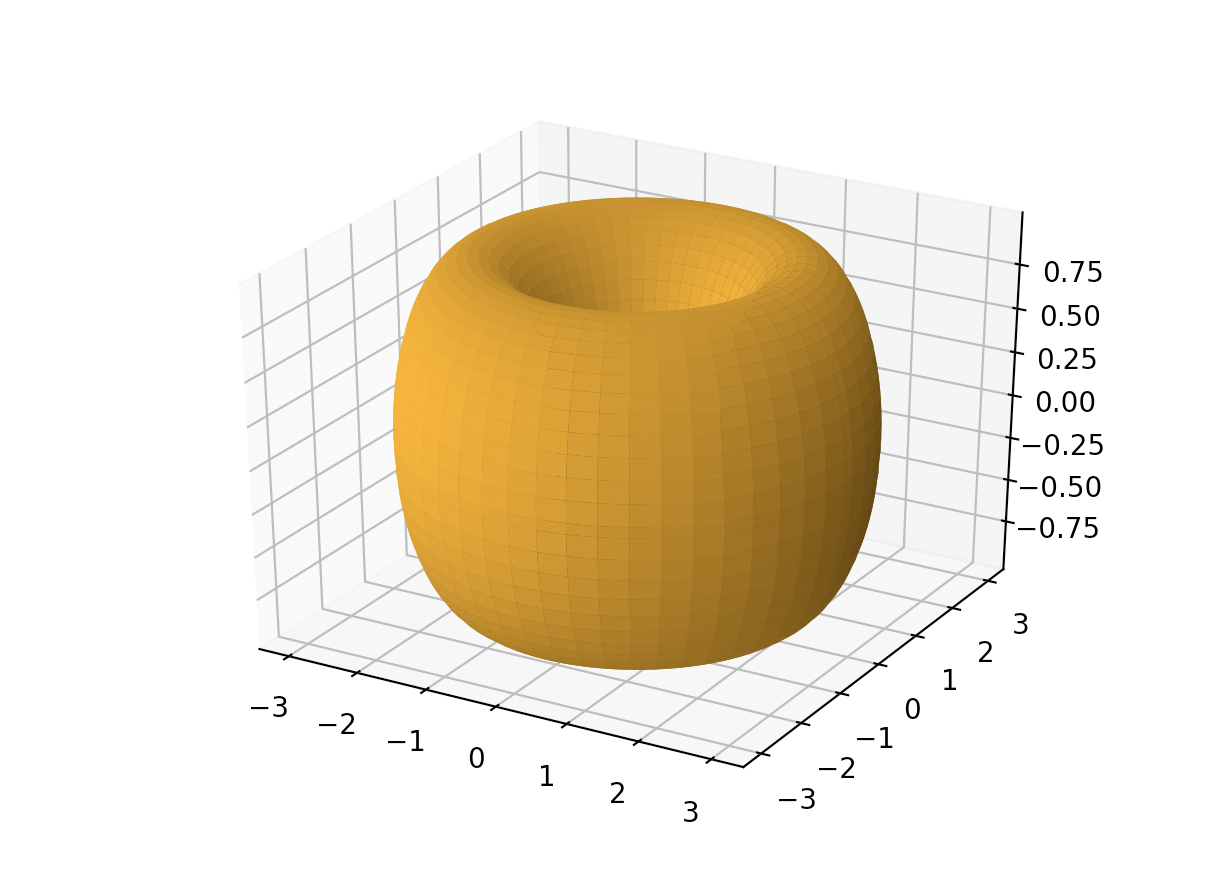
In geometry, a torus is a surface generated by revolving a circle in three-dimensional space about an axis that is coplanar with the circle. To make it simple, it has the form of a ring or of a donut. How can we plot it with Python? Well, matplotlib’s 3D plotting needs three coordinate arrays, so […]
