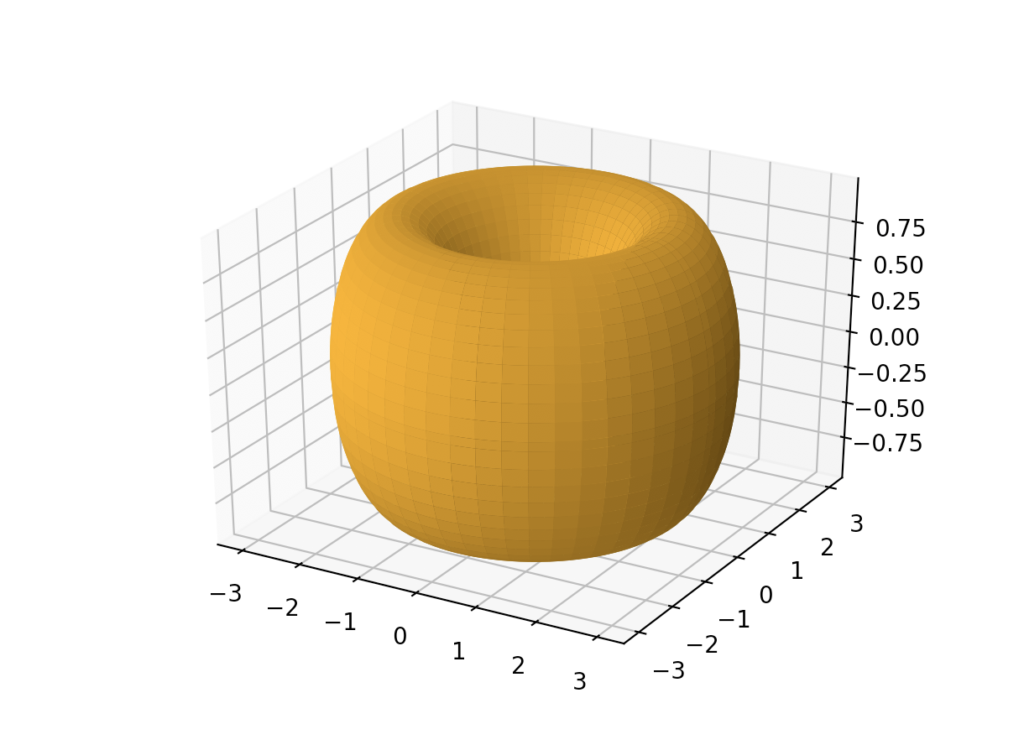
In geometry, a torus is a surface generated by revolving a circle in three-dimensional space about an axis that is coplanar with the circle.
To make it simple, it has the form of a ring or of a donut.
How can we plot it with Python? Well, matplotlib’s 3D plotting needs three coordinate arrays, so we have to take a look at the parametric equations of a torus.
Torus Parametric Equations
 \cdot \cos{u} \\ y = (c + a \cos{v}) \cdot \sin{u} \\ z = a \sin{v} \end{cases}")
These are the parametric equations of a Torus, where a, c are constants and u, v are variables.
So now we need a way to implement it in Python, and what’s better than marvelous numpy library?
Python Implementation
import numpy as np
import matplotlib.pyplot as plt


def plot_torus(precision, c, a):
    U = np.linspace(0, 2*np.pi, precision)
    V = np.linspace(0, 2*np.pi, precision)
    U, V = np.meshgrid(U, V)
    X = (c+a*np.cos(V))*np.cos(U)
    Y = (c+a*np.cos(V))*np.sin(U)
    Z = a*np.sin(V)
    return X, Y, Z


x, y, z = plot_torus(100, 2, 1)

fig = plt.figure()
ax = fig.gca(projection='3d')

ax.plot_surface(x, y, z, antialiased=True, color='orange')
plt.show()
Let’s explain what’s happening.
np.linspace generates an array of ‘precision’ (in this case 100) elements in arithmetic progression.
np.meshgrid returns all the possible precision^2 couples of points in space by creating two arrays: one for the x-coordinates and one for the y-coordinates.
To let you have an idea of how it works, see this code:
import numpy as np

xvalues = np.array([0, 1, 2, 3, 4])
yvalues = np.array([0, 1, 2, 3, 4])

X, Y = np.meshgrid(xvalues, yvalues)

print(X)
print(Y)
Its output is:
[[0 1 2 3 4]
 [0 1 2 3 4]
 [0 1 2 3 4]
 [0 1 2 3 4]
 [0 1 2 3 4]]
[[0 0 0 0 0]
 [1 1 1 1 1]
 [2 2 2 2 2]
 [3 3 3 3 3]
 [4 4 4 4 4]]
Now we head to the parametric equations: numpy lets you apply operations to the whole array with ease. For example summing two arrays with same shape sums the correspondent elements of the arrays, same for multiplying or dividing.
After that you initialize a matplotlib 3D axis. When plotting, ‘antialiased = True’ only means that we are removing some noise from the image, it doesn’t really affect the program.
The image at the beginning of the article is actually the program’s output.
So, that’s my first plot I’m sharing, get ready to see some more.