In Python as you know there’s the option of plotting 3D graphs, so why not fully exploiting such possibilities?
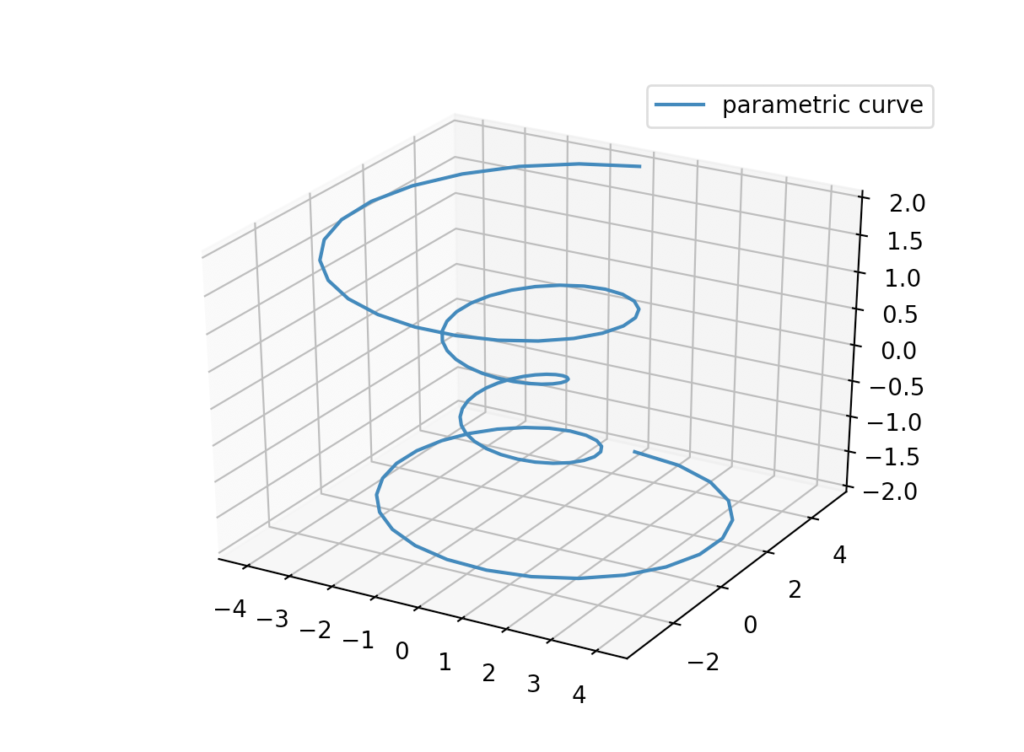
In this example I will show a sort of an irregular spiral figure.
import matplotlib as mpl
import numpy as np
import matplotlib.pyplot as plt

mpl.rcParams['legend.fontsize'] = 10

fig = plt.figure()
ax = fig.gca(projection='3d')
theta = np.linspace(-4 * np.pi, 4 * np.pi, 100)
z = np.linspace(-2, 2, 100)
r = z**2 + 1
x = r * np.sin(theta)
y = r * np.cos(theta)
ax.plot(x, y, z, label='parametric curve')
ax.legend()

plt.show()
As you can see, you have to specify that you will plot in 3D. What I am doing is composing a parametric curve: x and y represent a circumference, but with varying radius (r) and height (z).
So the result is a spring-like figure plotted below.