An epicycloid is the figure that a fixed point of a circle draws when the circle rotates on the circumference of another one.
How to plot such things in Python? There is a trick: such figures depend on the ratio of the still circle’s and the rotating circle’s radius. Let’s say we have an integer ratio n. If you label some equally distanced points on the circle from 1 to some k and then match each point j with (n+1)j (taken modulo k), then you’ll obtain the desired figure.
Here’s the Python implementation of such an idea, where n is not the ratio but the multiplication coefficient.
import numpy as np
import matplotlib.pyplot as plt


def epicycloid_plotter(precision, n):
    X = np.cos(np.linspace(0, 2*np.pi, precision))
    Y = np.sin(np.linspace(0, 2*np.pi, precision))

    plt.figure(figsize=(19.2, 14.4))
    plt.plot(X, Y, c='r')
    final = zip(X, Y)

    X_1 = np.cos(n*np.linspace(0, 2*np.pi, precision))
    Y_1 = np.sin(n*np.linspace(0, 2*np.pi, precision))
    final_1 = zip(X_1, Y_1)

    finale = zip(final, final_1)
    for i in finale:
        plt.plot([i[0][0], i[1][0]], [i[0][1], i[1][1]], c='r')

    plt.axis('equal')
    plt.savefig('heart.jpg')
    plt.show()
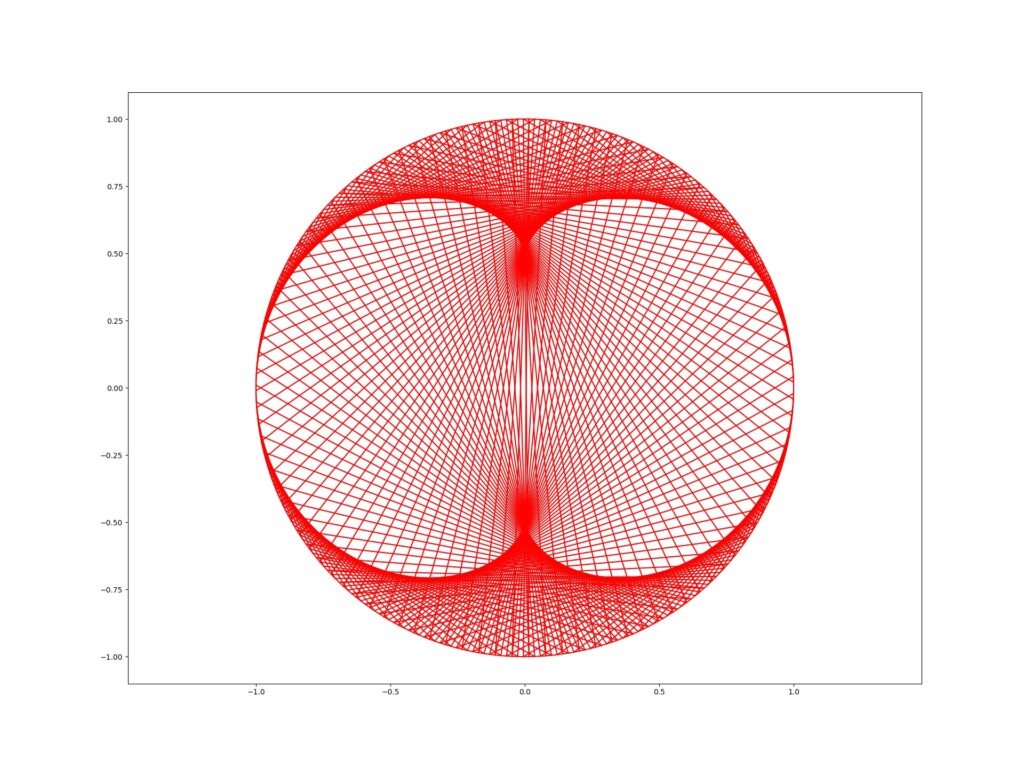
Here’s the result with n = 2 and precision = 200. Obviously more precision means a better defined figure.
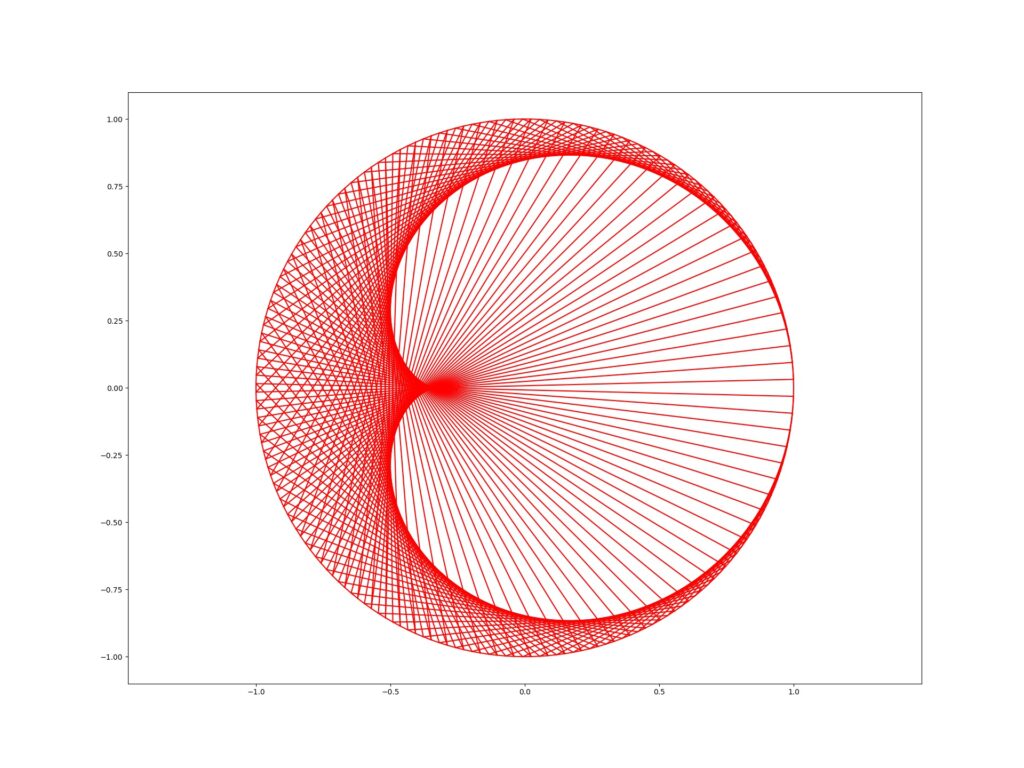
I’ll also show the result for n = 3 and precision = 300.