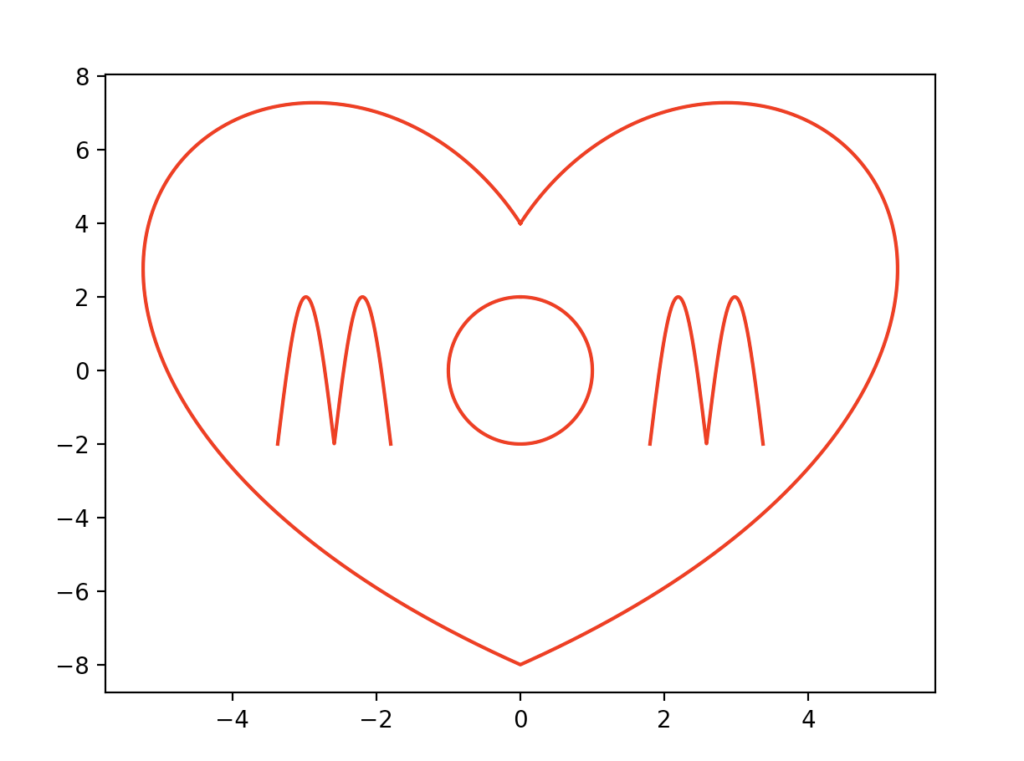
I Made this nice plot for my mother’s birthday (which is today, 4th December) and I thought it would be nice to share it.
import numpy as np
import matplotlib.pyplot as plt


def heart_plotter(precision):
    t = np.linspace(0, 60, precision)
    X = 1/100*(-t**2 + 40*t + 1200)*np.sin(t/90)
    Y = 1/100*(-t**2 + 40*t + 1200)*np.cos(t/60)
    Y_1 = 1/100*(-t**2 + 40*t + 1200)*np.cos(t/60)
    X_1 = -1/100*(-t**2 + 40*t + 1200)*np.sin(t/90)

    X = np.concatenate((X, np.flip(X_1)))
    Y = np.concatenate((Y, np.flip(Y_1))) - 8

    return X, Y


def o_plotter(precision, r):
    t = np.linspace(0, 2*np.pi, precision)
    X = np.sin(t)*r
    Y = 2*np.cos(t)*r

    return X, Y


def m_plotter(precision, r, position):
    t = np.linspace(0, 2*np.pi/r, precision)
    X = t-position
    Y = np.abs(np.sin(t*r))*4-2

    return X, Y


x, y = heart_plotter(1000)
a, b = o_plotter(1000, 1)
c, d = m_plotter(1000, 4, np.pi/2+1.8)
e, f = m_plotter(1000, 4, -1.8)


plt.plot(x, y, c='r')
plt.plot(a, b, c='r')
plt.plot(c, d, c='r')
plt.plot(e, f, c='r')

plt.show()
The plot is divided into 4 parts. The heart is the first function, the circle is the second function and the other letters are represented and translated by the third function.
Here’s the output.

Happy Birthday Mom!