I really like plotting waves in Python: there are many ways you can show interesting patterns both in 2D and 3D.
I’m obviously using the numpy and matplotlib libraries to create and plot the functions.
2D Wave Plot
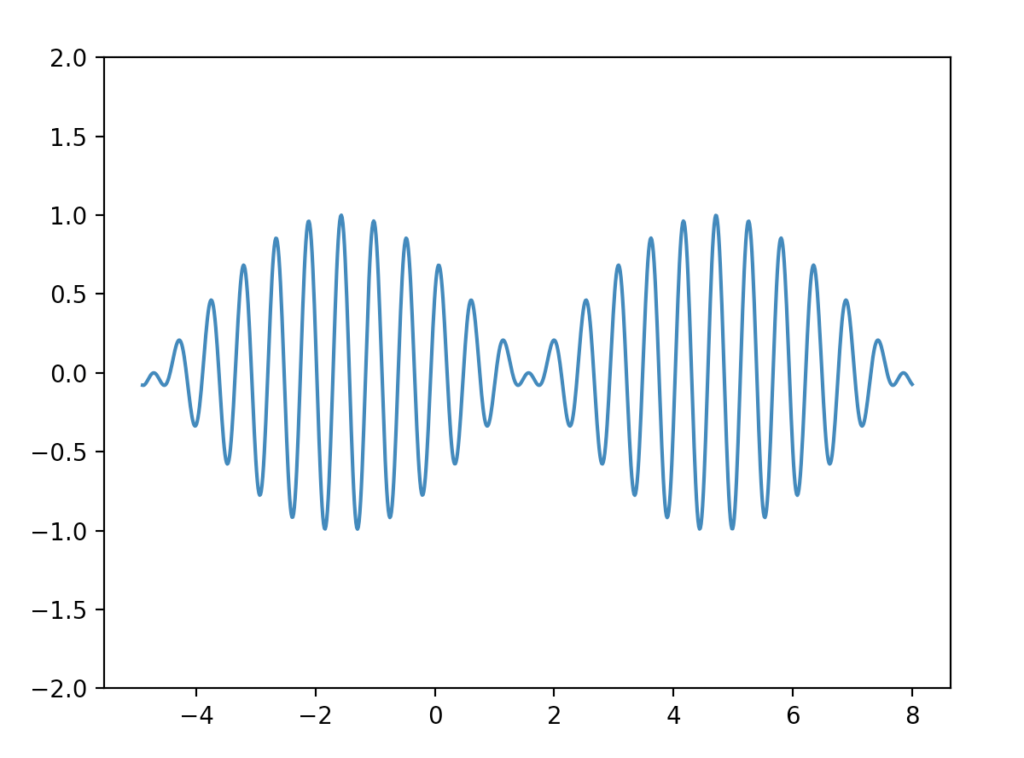
I really wanted to try to reproduce Arctic Monkeys’ AM cover image, and that’s what I was able to come up with:

import numpy as np
import matplotlib.pyplot as plt

xmax = 8
xmin = -4.9
precision = 1000

pointsx = np.linspace(xmin, xmax, precision, dtype=np.float64)
pointsj = np.linspace(xmin, xmax, precision, dtype=np.float64)
pointsy = (np.cos(12*pointsx)+np.sin(11*pointsx))/2
plt.ylim(-2, 2)
plt.plot(pointsx, pointsy)
plt.show()
plt.ylim means I want to see the graph only for the y interval (-2, 2).
The trick is summing two sine or cosine functions in a way that the mcm of their periods is the greatest possible, so it’s good to choose two coprime very similar numbers, so any n, n+1 is a good try.
3D Wave Plot
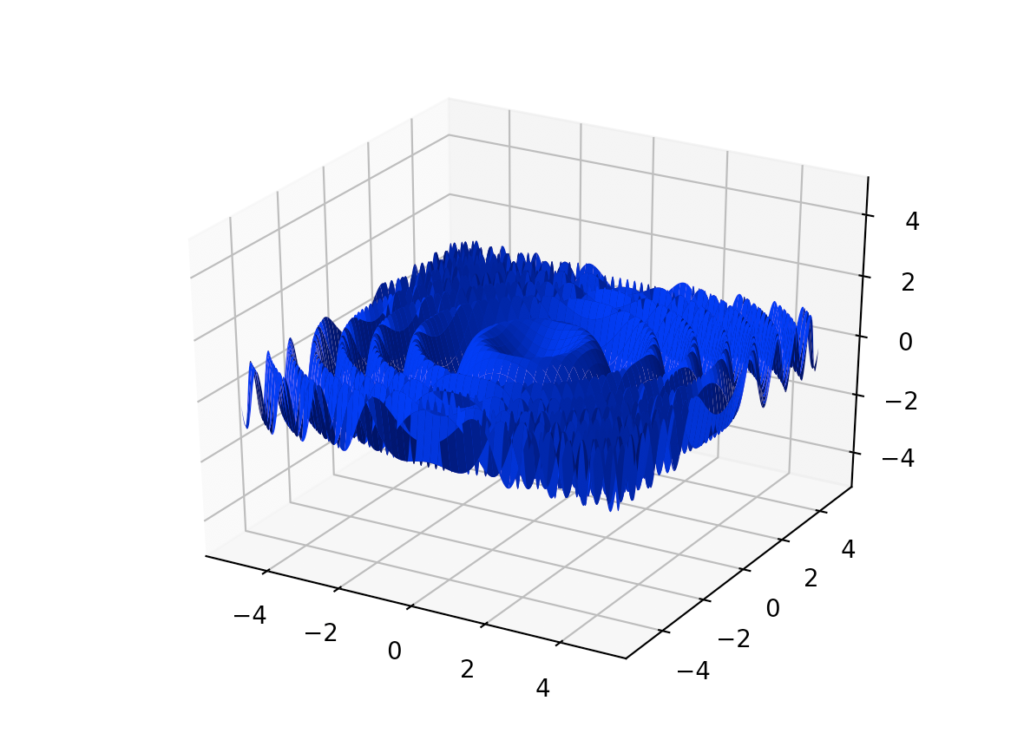
This plot is more complicated and reminds me of when you throw a rock in the water.

The code is:
import numpy as np
import matplotlib.pyplot as plt


def wave_plotter(x_min, x_max, y_min, y_max, precision):
    X = np.linspace(x_min, x_max, precision, dtype=np.float64)
    Y = np.linspace(y_min, y_max, precision, dtype=np.float64)
    X, Y = np.meshgrid(X, Y)
    Z = np.sin((X ** 2 + Y ** 2))
    return X, Y, Z


x, y, z = wave_plotter(-5, 5, -5, 5, 1000)
fig = plt.figure()
ax = fig.gca(projection='3d')

ax.plot_surface(x, y, z, antialiased=True, color='blue')

ax.set_zlim3d(-5, 5)
plt.show()
So, I’m fixing x and y, and then creating all the possible couples with np.meshgrid (for more information check my previous post https://www.mattiagiuri.com/2020/11/20/plotting-a-torus-with-python/).
ax.set_zlim3d is just like plt.ylim but for the 3D z axis.
The fact that the waves progressively shrink is given by the fact that a sum of squares tend to increase faster than any linear combination of two variables. As you increase the exponent (but it has to be even to preserve the positive sign) the waves become narrower more quickly.